Filter by topic:
37 articles found
Article
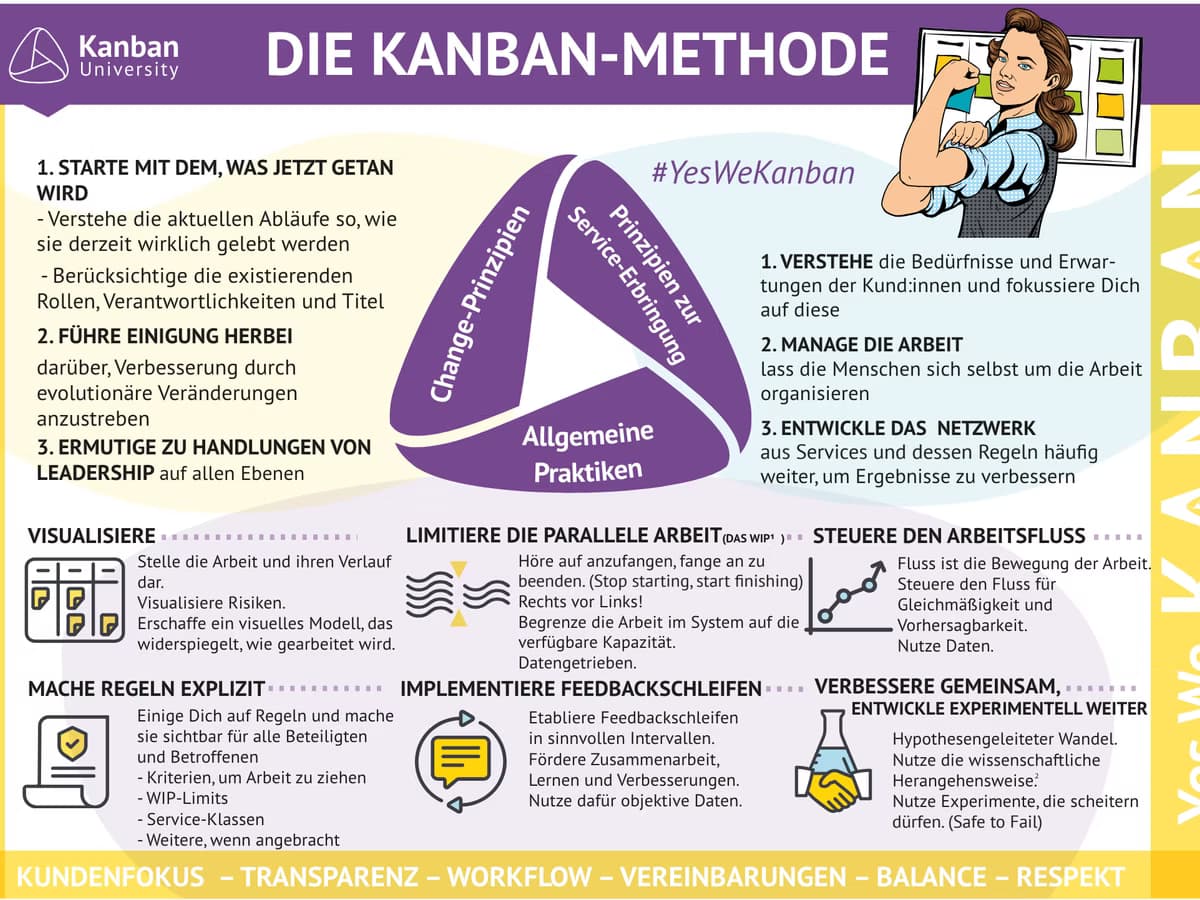
The Kanban method is defined as - an alternative path to agility - a method for organizational adaptation and improved business agility.
Andrea Giugliano
Article
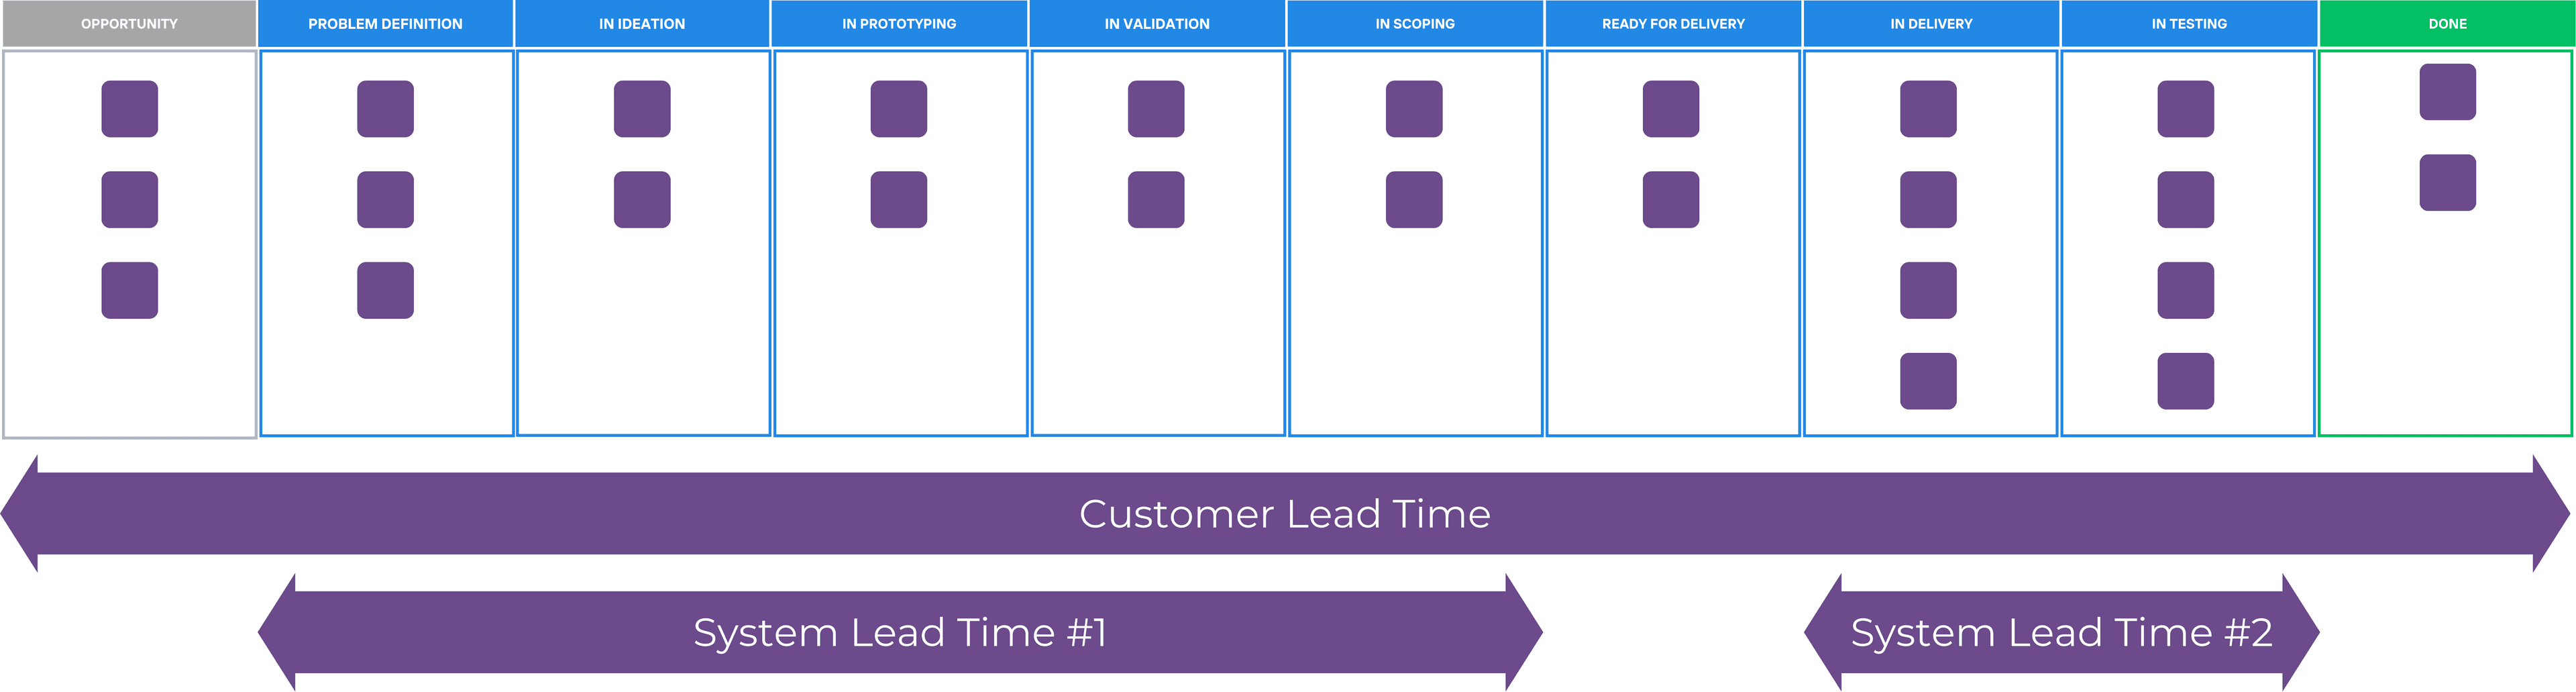
Kanban, is renowned for its simplicity and effectiveness in managing workflows across various industries. By visualizing work, limiting work in progress, and enhancing flow, Kanban helps teams increase efficiency and improve delivery.
Andrea Giugliano
Article
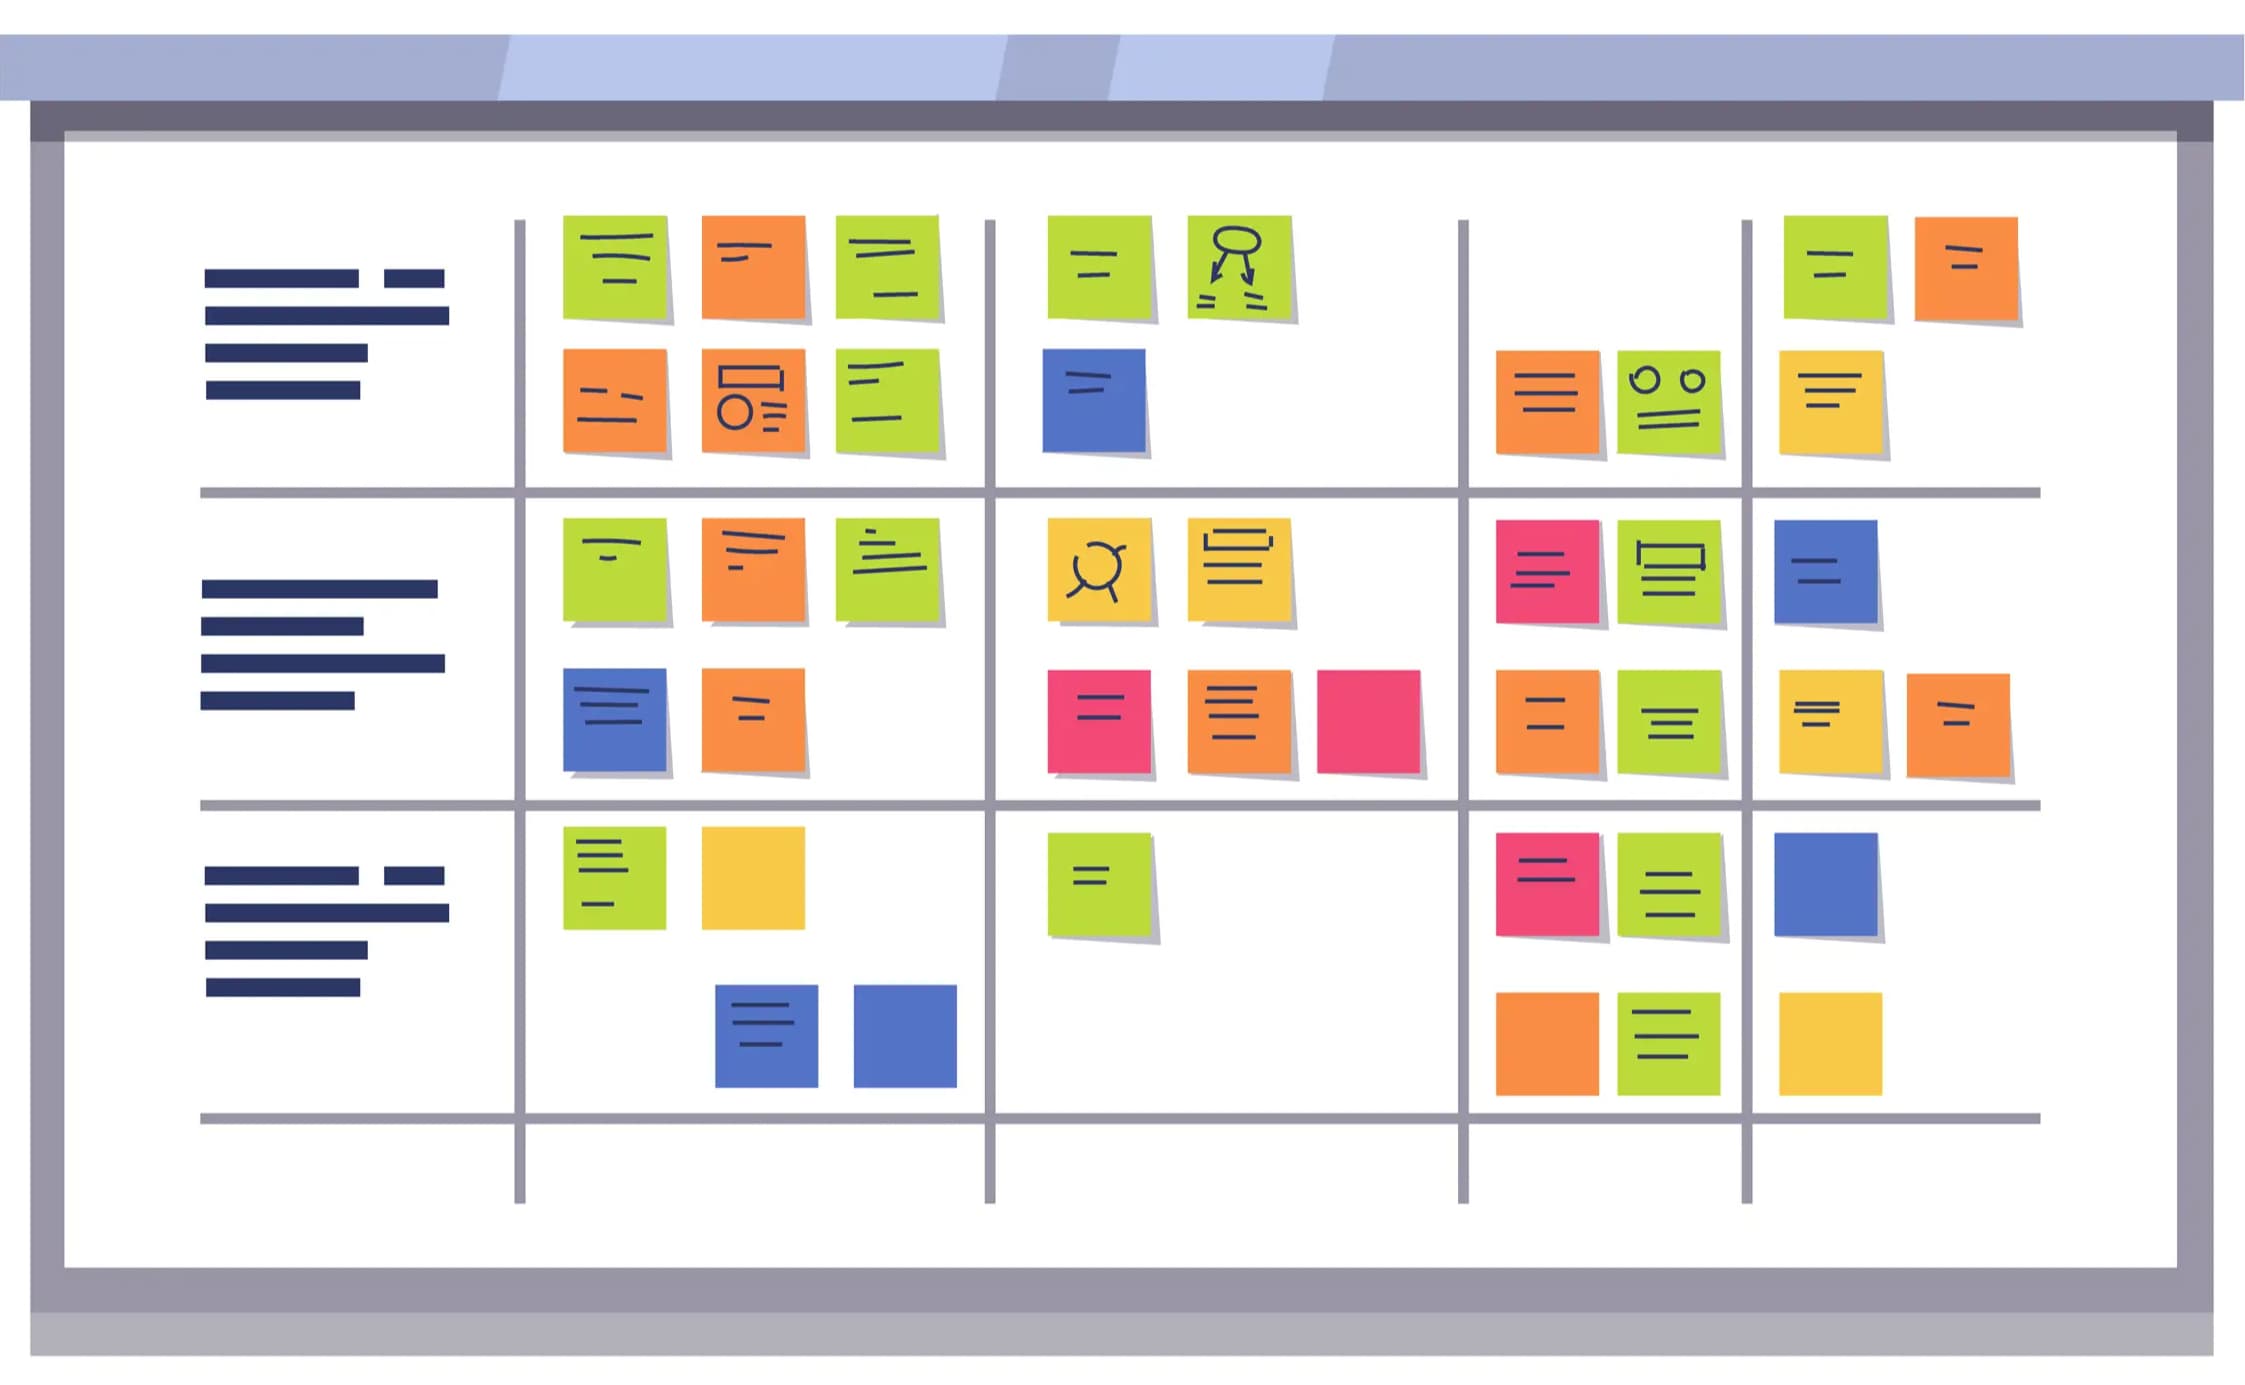
Kanban boards are visual tools that help manage workflows, improve transparency and encourage team collaboration!
Andrea Giugliano
Article
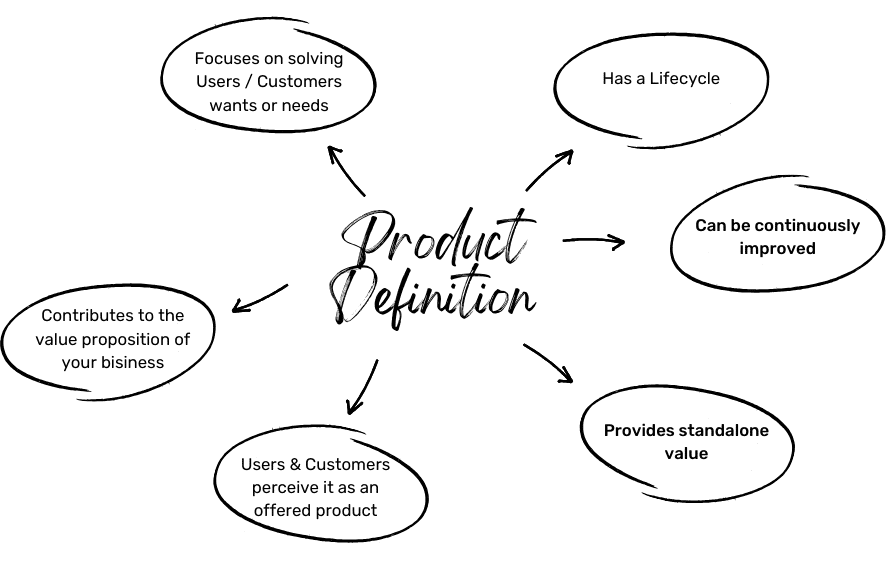
Looking at what is happening in different organizations, we saw that the term “product” is tossed around with such ease that its true essence is getting lost. However understanding how your organization defines a product and what products your business is focused on is the foundation for success and satisfied users and customers.
Andrea Giugliano
Article
Product Discovery helps you avoid building things nobody wants.
Corinna Böcklinger-Giugliano
Article
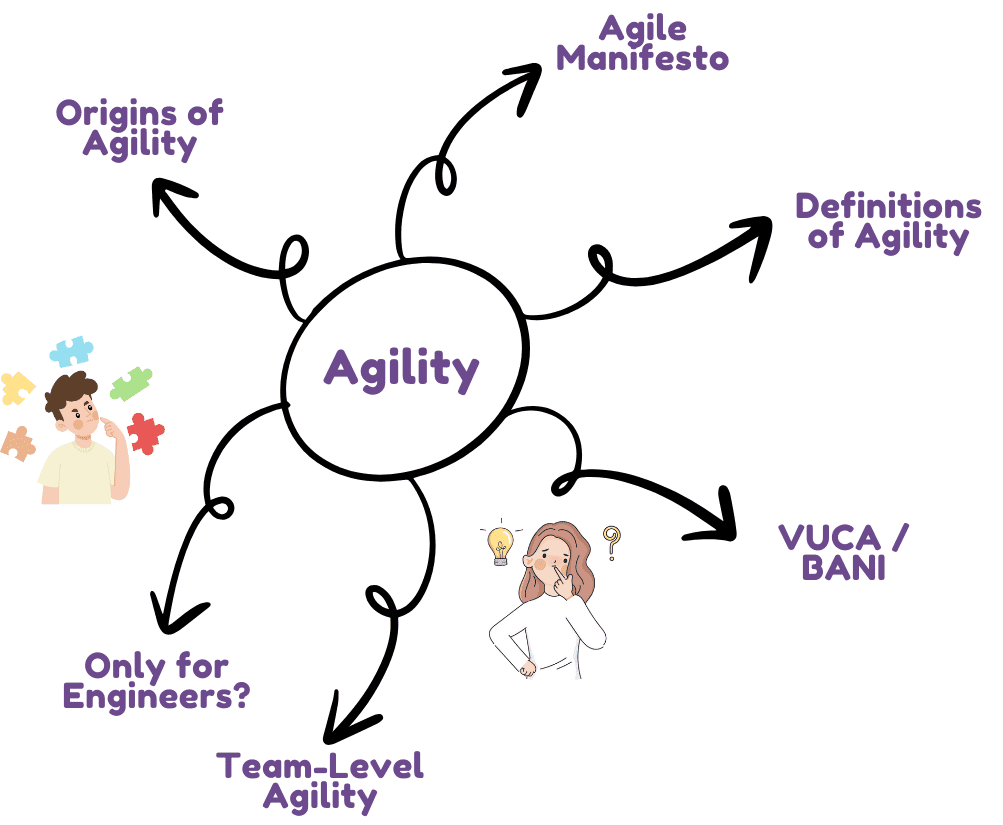
Agility has become indispensable in a landscape defined by rapid change and constant evolution. Originally designed for software development, agile has expanded its reach, significantly impacting project management, product management, leadership, and organizational development and culture.
Andrea Giugliano
Guide
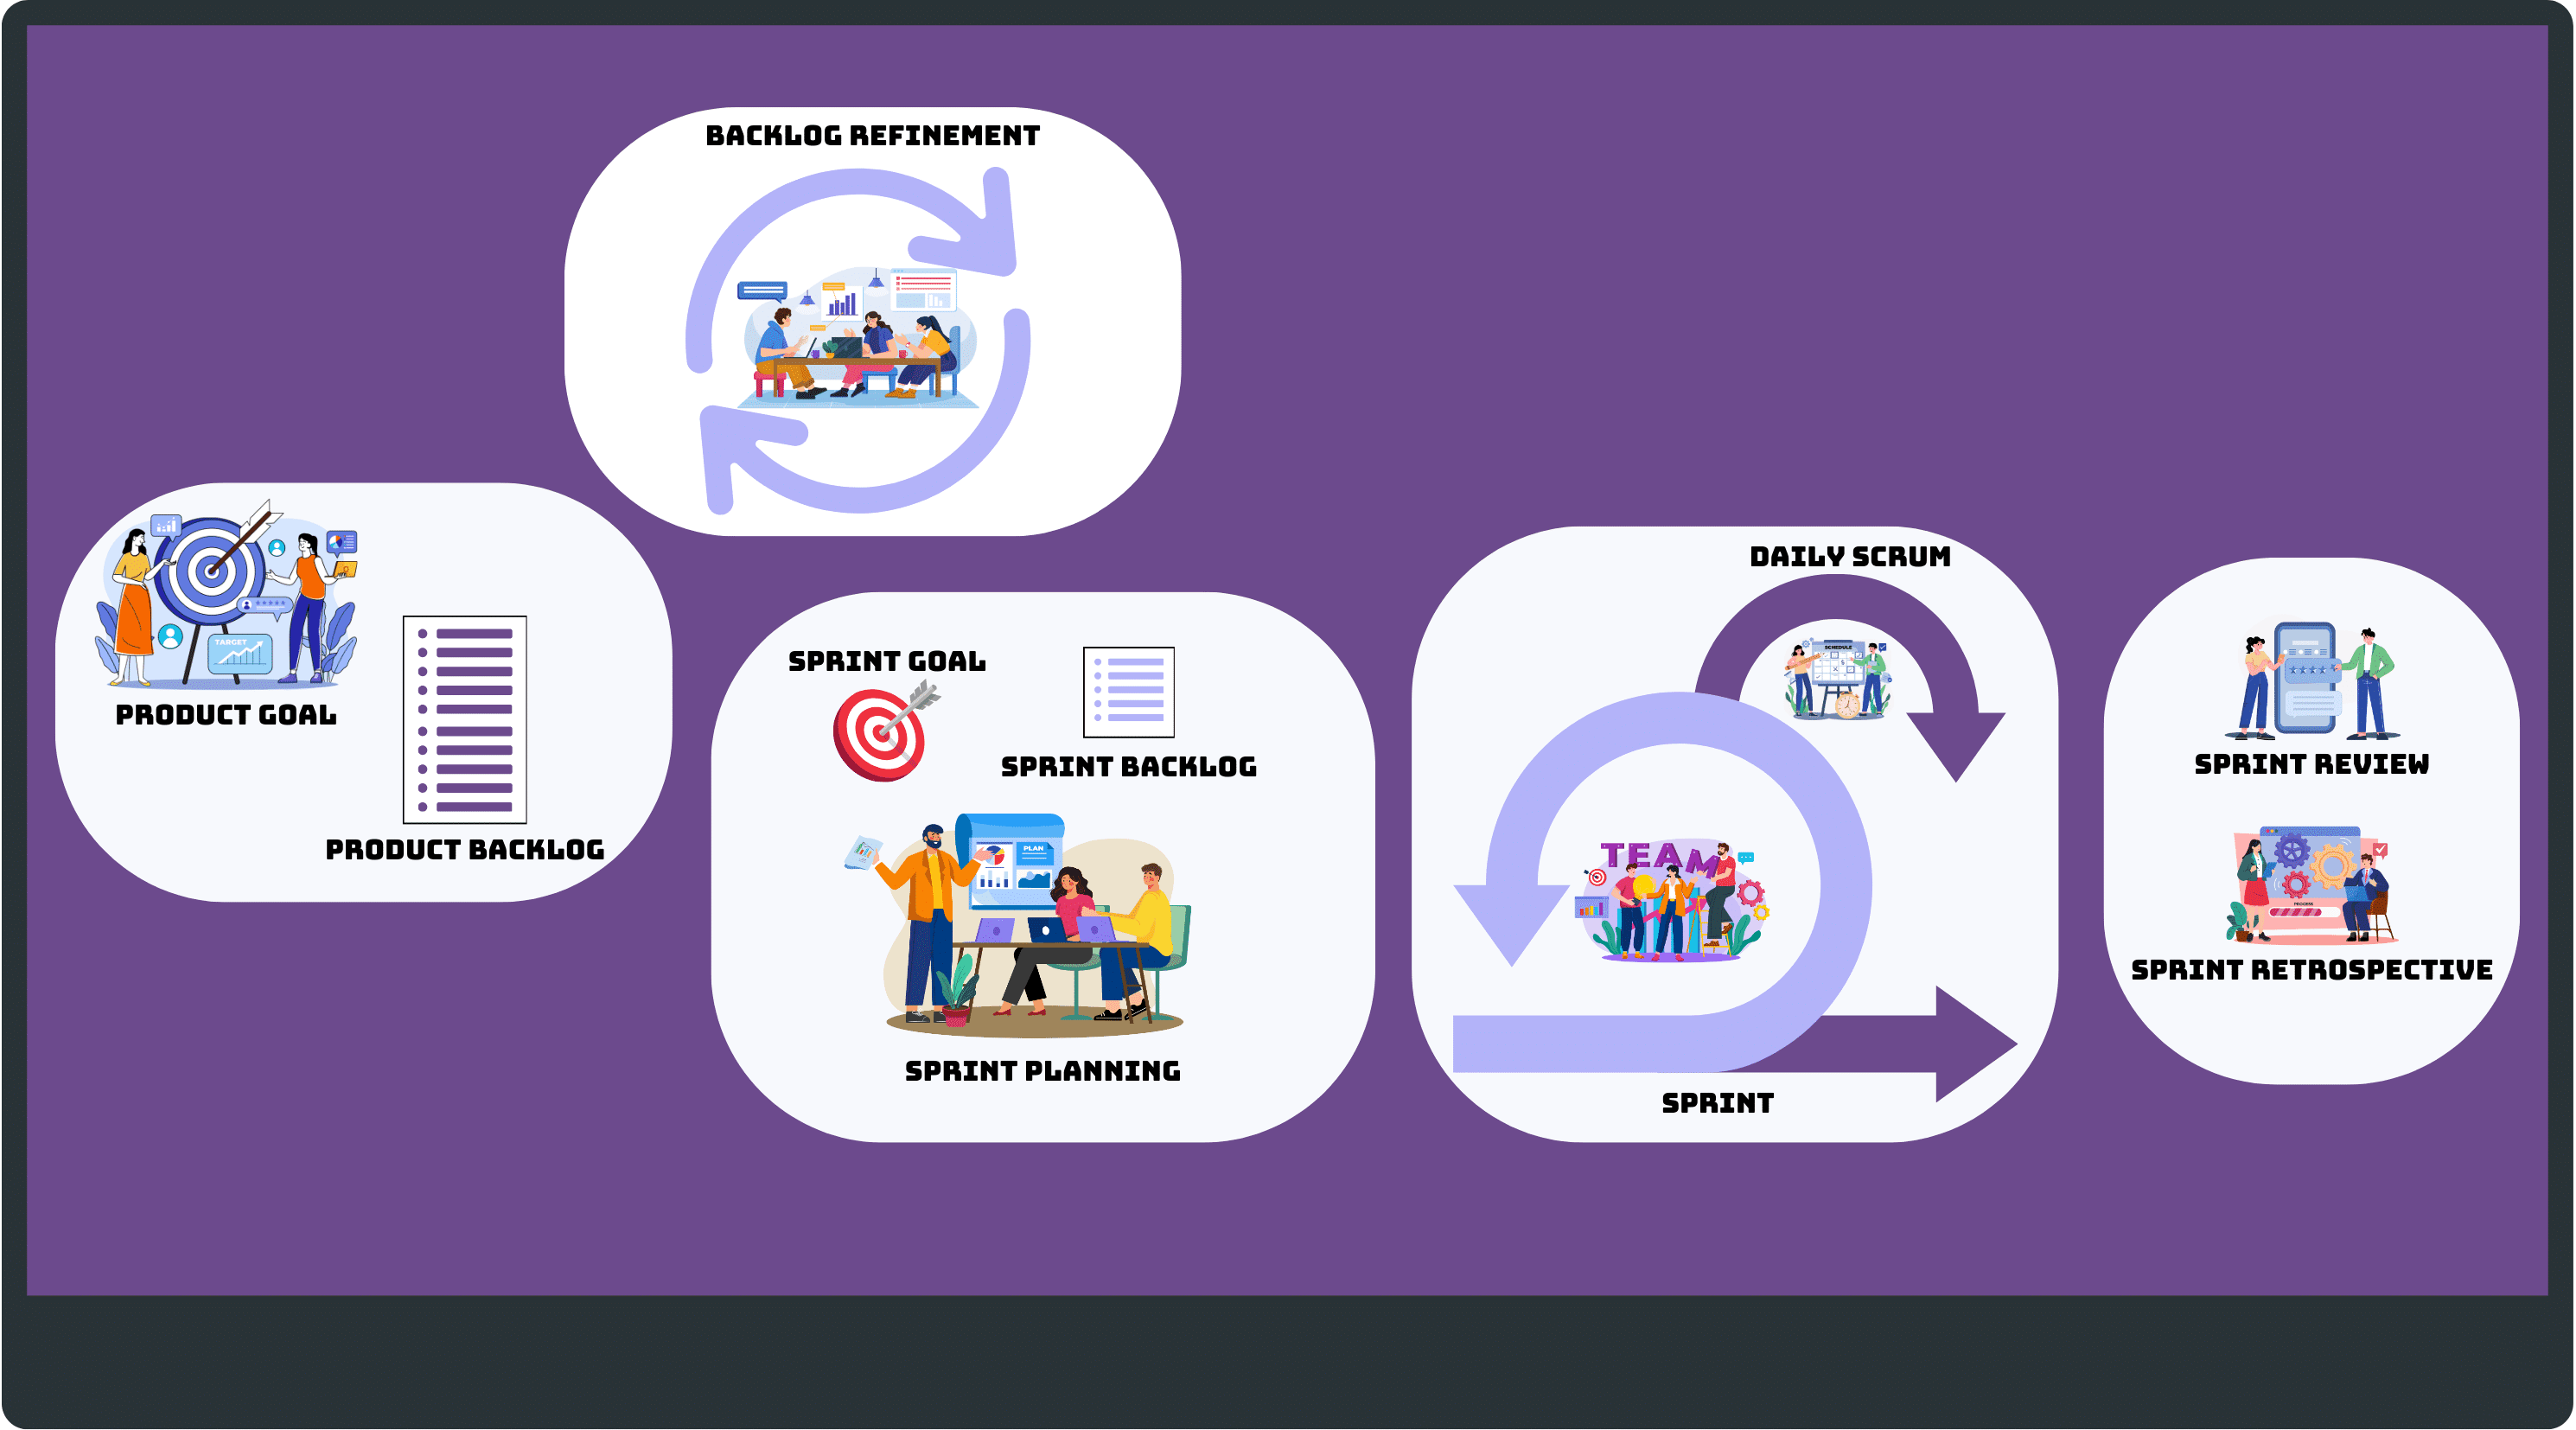
Welcome back to the Ultimate Guide to Agile! In Part 1, we explored the basics of Agile, its principles, and some popular frameworks.
Now, in Part 2, we’ll delve deeper into how agility works on a team level, provide a detailed look at the Scrum Framework, and discuss common approaches and pitfalls when introducing agility to teams.
Andrea Giugliano

Guide
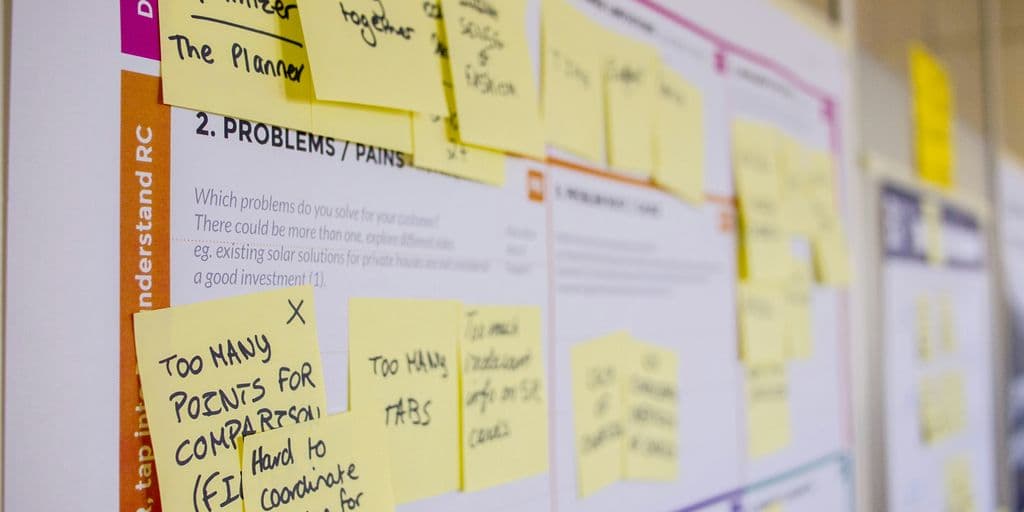
Have you ever felt overwhelmed by the multitude of ideas and tasks competing for your attention in product development? You are not alone. Product Prioritization is an essential skill for product managers, and choosing the right method can make the difference between success and failure.
Corinna Böcklinger-Giugliano
Article
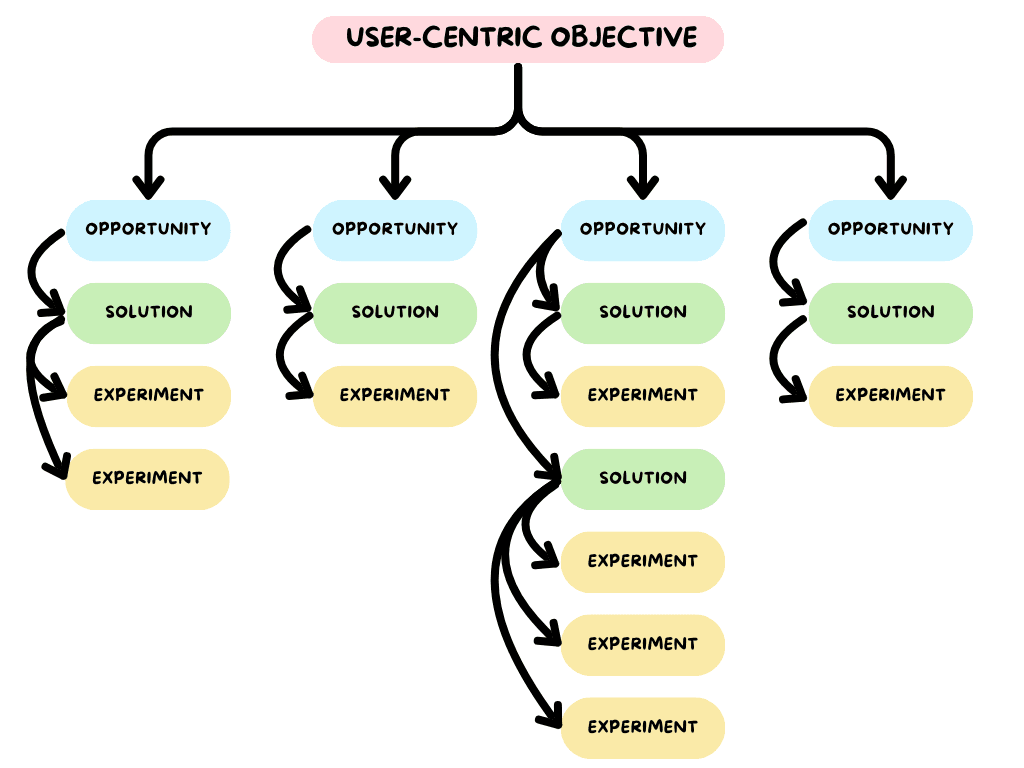
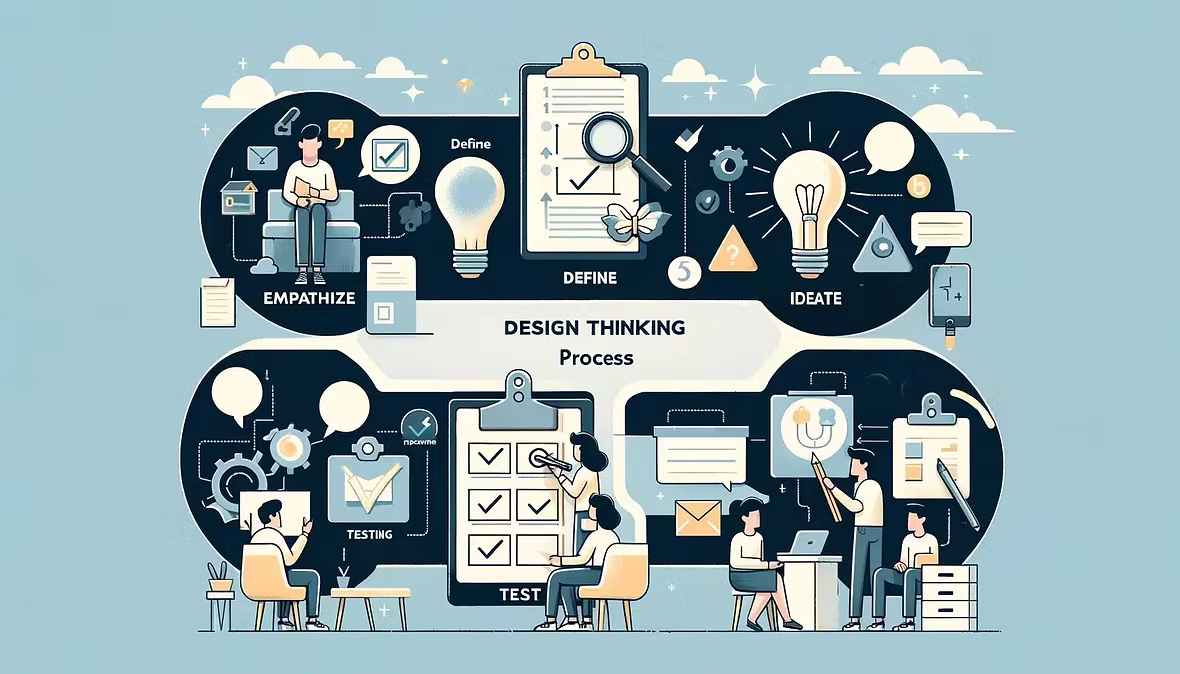
Both methods – Design Thinking and Opportunity-Solution-Tree – share one common goal: to create and build products that customers really love.
Corinna Böcklinger-Giugliano
Article
Implementing a Kanban system can help teams better organize their workflows, increase productivity, and create transparency. But as with any method, there are pitfalls that can quickly jeopardize the added value of a Kanban system.
Andrea Giugliano
Article
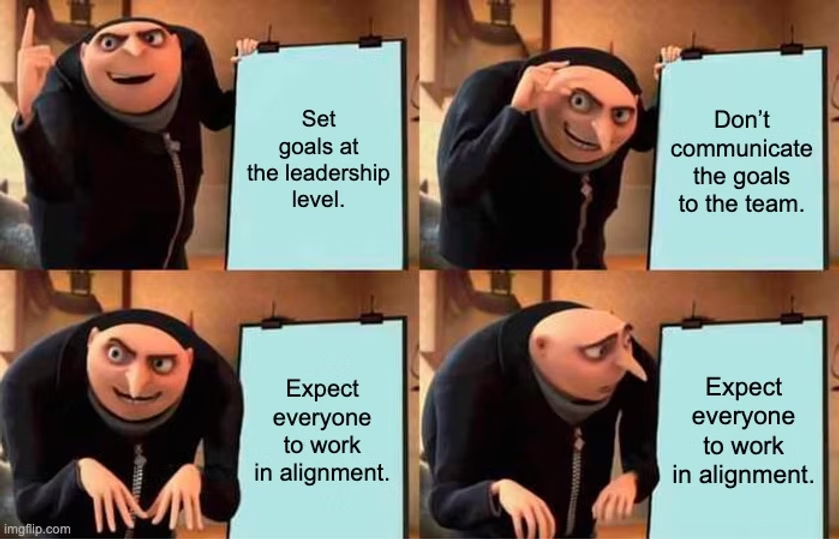
Imagine this: Employees feel frustrated, unsure of their priorities, constantly asking, "What are we supposed to be working on? Why should we be working on this?" Meanwhile, leaders scratch their heads, wondering why their goals aren’t being met. Does this sound familiar? This disconnect is one of the most common challenges businesses face — and it often stems from a single root cause: a lack of transparency.
Andrea Giugliano
Guide
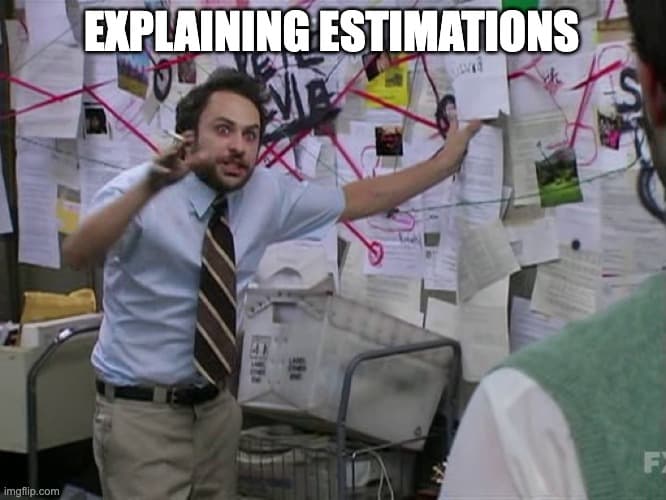
Let’s talk about estimations. No matter the project or task, someone will always ask, “How long will it take?” What seems like a straightforward question often turns into a rabbit hole of debates, disagreements, and dissatisfaction on every side.
Andrea Giugliano
Guide
Work can get messy, right? You’ve got tasks piling up, emails coming in faster than you can read them, and a to-do list that seems to grow on its own.
That’s where the Kanban Method can help. It’s a straightforward way to stay organized, tackle your workload, and actually finish what you start.
Andrea Giugliano
Article
Why Agile Coaches and Scrum Masters Matter: Agile Coaches and Scrum Masters are in my opinion crucial for supporting organizations manage change, question on how they operate and help them improve continuously towards effectiveness and better ways of working.
Andrea Giugliano
Article
Organizations face a choice: focus on people or frameworks. Spoiler alert: frameworks are just tools. They’re not magical solutions that fix everything. Misuse them, and you’ll have blocked creativity, slow decisions, and a workforce distracted by process instead of progress.
Andrea Giugliano
Article
Product Discovery and UX Research are often confused. But what is the difference? Learn how these two approaches complement each other and when to use which method.
Corinna Böcklinger-Giugliano
Guide
User Story Mapping is an amazing way to get your head around your product without drowning in a dull to-do list. It helps teams see what actually matters - how users interact with the product and what needs to be built first.
Andrea Giugliano
Article
Successful product development begins with sound product discovery. Find out which methods you can use to develop customer-oriented and innovative products.
Corinna Böcklinger-Giugliano
Article
How can you combine Product Discovery with Kanban? Learn how to use agile methods to iteratively explore customer needs, test product ideas, and make better decisions.
Corinna Böcklinger-Giugliano

Article
Let's be honest, Scrum can sometimes feel like a bizarre social experiment gone wrong. You've got your daily stand-ups that somehow morph into hour-long therapy sessions, sprints that resemble a hamster wheel of doom, and a backlog that's longer than your last grocery receipt.
Andrea Giugliano
Article
Are you finding it hard to use Scrum in your company? Do your projects seem to take too long or not deliver what you hoped for?
As an expert in Agile methodologies and organizational development, I've witnessed firsthand the transformative power of Scrum when implemented effectively. Throughout my years of experience, I've seen countless teams struggle with Scrum, often due to common misconceptions and pitfalls.
Andrea Giugliano
Article
Alright, let’s talk about Kanban vs. Scrum because deciding how to organize work can be as overwhelming as choosing a coffee at a fancy café. Do you go for a structured, predictable system like following a detailed recipe for a caramel macchiato (Scrum), or do you prefer a more adaptable approach like a barista adjusting a pour-over based on the grind and water temperature (Kanban)?
Andrea Giugliano

Article
Kanban is a way to keep things running smoothly at work. It's like having a big board where you can see all the tasks that need doing. This helps everyone know what to focus on and makes sure nothing gets forgotten. In 2025, using Kanban is more important than ever because it helps teams work better together, especially with all the new tech and remote work happening. Let's look at the best ways to use Kanban now and in the future.
Andrea Giugliano

Article
Switching to Agile and smartly designing your organization can seem like a big deal, but it doesn't have to be. Think of it as a way to work better, not harder. Agile is about being flexible and open to change. And when your organization is set up just right, everything clicks into place. It's like when all the gears in a clock are working together perfectly. This article will walk you through some easy tips and tricks to get started on your Agile journey and help your organization.
Andrea Giugliano

Article
The Agile Manifesto has revolutionized the way we develop software. It emerged from the need to find more flexible and efficient methods to meet the challenges of ever-changing requirements. In 2001, 17 software developers met at a ski resort in Utah to share their experiences and ideas. The result was a manifesto that established four core values and twelve principles that still form the foundation for agile methods today.
These principles promote a culture of collaboration, adaptability, and continuous improvement. While the Agile Manifesto was originally designed for software development, it has since found application in other industries.
Andrea Giugliano

Article
Product Discovery Interviews are a central component when it comes to developing successful products. They help to better understand the actual needs of users and make informed decisions. But how do you conduct such interviews without falling into common traps? In this article, I’ll show you how to prepare optimally, which questions to ask, and how to effectively use the insights you gain.
Corinna Böcklinger-Giugliano

Article
Kanban is more than just a trend today. It is a proven method to visualize workflows, identify bottlenecks, and increase efficiency. But how do you truly master it? A certified Kanban training can be the key to mastering these skills and standing out from the crowd.
Andrea Giugliano
Article
Sometimes it feels like product teams live in two worlds. On one side is discovery – understanding what customers really need. On the other side is delivery – actually implementing and providing these solutions. Both are important, but they have different goals and approaches. In this article, we’ll take a closer look at the differences between "Product Discovery" and "Product Delivery.
Corinna Böcklinger-Giugliano

Article
Traditional leadership styles are increasingly reaching their limits. Agile leadership methods offer an answer to the challenges of the modern workplace. But what does that actually mean? And how can leaders successfully implement this approach? This article explores the basics, benefits, and pitfalls of agile leadership and explains why it is so important today.
Andrea Giugliano
Article
Project management is a topic that concerns many of us, whether at work or in our personal lives. There are two major approaches: traditional and agile. But which one is better? And why should you even bother with it? That's exactly what we're going to look at today.
Andrea Giugliano
Article
Are you encountering obstacles in your product development journey? Do you aspire to create products that truly resonate with your customers and surpass their expectations?
Having worked closely with numerous Product Owners, I've seen firsthand the challenges they face and the triumphs they celebrate in the ever-evolving world of product development. This blog post draws upon that experience to provide a comprehensive understanding of the Product Owner's role in Scrum and offer practical guidance for effective product development.
Corinna Böcklinger-Giugliano
Guide
Writing good user stories is essential for effective agile development. A well-crafted user story helps teams understand what needs to be built, why it's important, and how to ensure it meets user needs. This guide will walk you through writing clear, actionable user stories that drive successful product development.
Andrea Giugliano
Guide
Product discovery is like the compass for your product journey. It’s all about figuring out what your audience really needs and how to deliver that in a way that works. Whether you’re building something brand new or tweaking an existing product, getting this step right can save you time, money, and headaches down the line. This guide will break it all down for you, from understanding the basics to tackling challenges and staying ahead with fresh strategies.
Andrea Giugliano

Article
As organizations face constant shifts in technology, market demands, and societal expectations, leaders must learn to navigate these challenges with agility. This article explores the core principles of Adaptive Leadership, its significance in modern contexts, and strategies for leaders to enhance their adaptive skills.
Andrea Giugliano

Article
Understanding outcomes is important for anyone aiming for success, be it short- middle- or long-term. In business, education, or personal growth, outcomes serve as a key measure of our efforts. They reflect our progress and guide our future decisions and strategies. We will explore in this blog post the importance of outcomes, learn how to define and assess them, and recognize their role in different areas!
Andrea Giugliano

Article
Product discovery isn't just a step in the development process; it's at the heart of creating something that people really want. It's about finding out what people need and making sure your ideas hit the mark. If done right, it can make the difference between a product that flops and one that goes away. This article looks at the outcomes that really matter in product discovery.
Corinna Böcklinger-Giugliano

Article
Outcome Based Management is a strategy that prioritizes results over activities. It focuses on achieving valuable outcomes for stakeholders, leading to better performance and accountability. This approach helps organizations align their goals with measurable results, promoting a culture of responsibility and effectiveness.
Andrea Giugliano
Have Questions?
Want to learn more or have specific challenges? Schedule a free consultation.
Book a Call